https://andyreagan.com/visualizations.html
Visualizations
A selection of the interactive visualizations I have built, all of them live: click a picture to go play with the real thing. I also teach data visualization at UC Berkeley.
Lately: personal data side projects
Dashboards and small tools built on my own running, riding, sleep and bloodwork data, plus a few for the town. Most of my current work is internal to MassMutual, so this is what I can share.
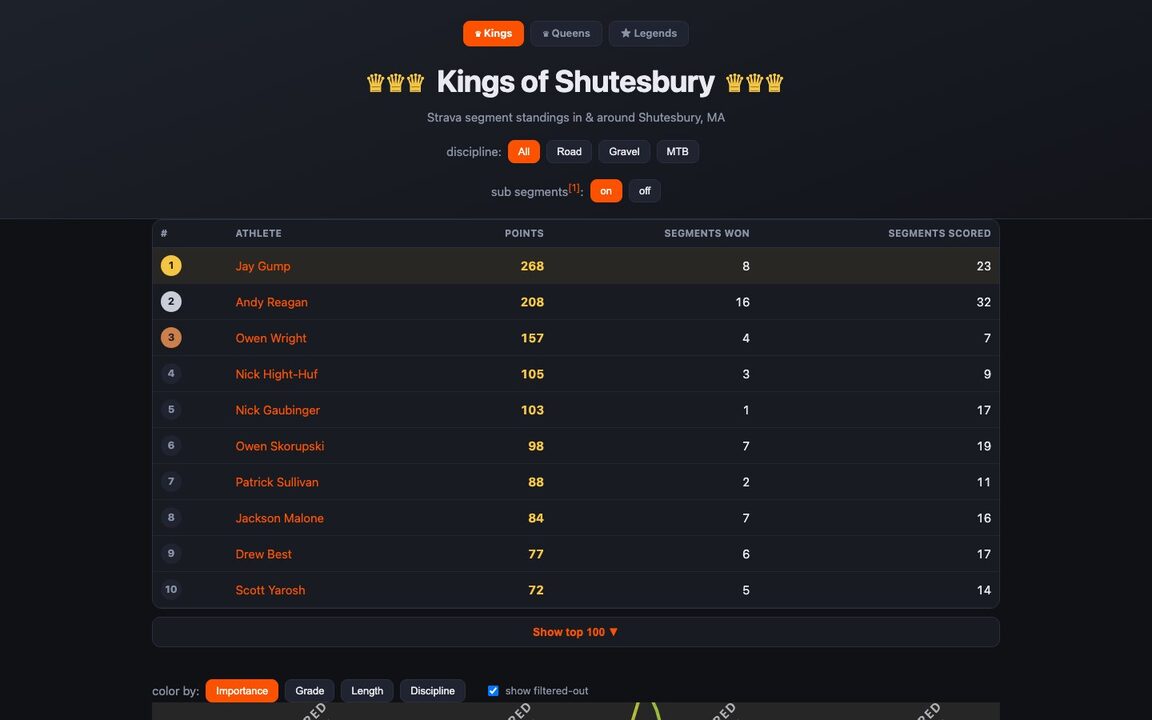 Kings of Shutesbury
Strava segment standings for every segment in town, with a map. Light on the visuals, but found a whole lot of in-town KOMs to explore.
post · 2026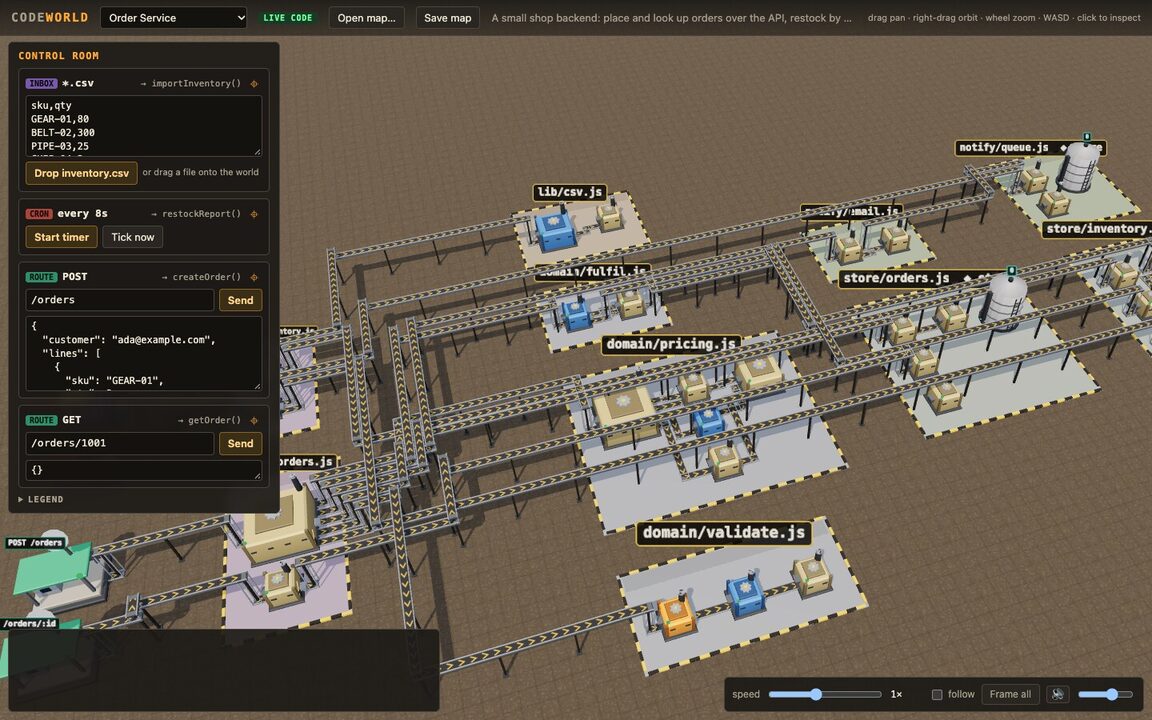 Codeworld
A codebase as a 3D factory you can fly around: files are buildings, calls ride the conveyor belts.
code · three.js · 2026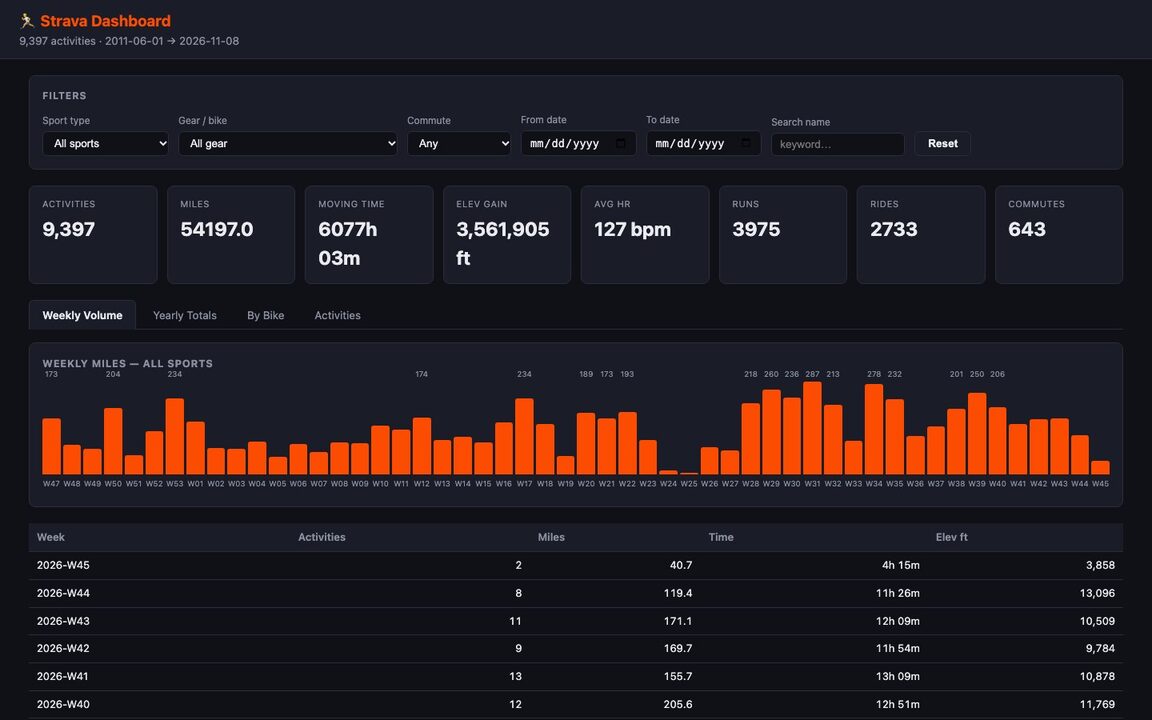 Strava dashboard
Fifteen years and 9,000+ activities: stats and a chart. Not really a vis, but it's something.
2026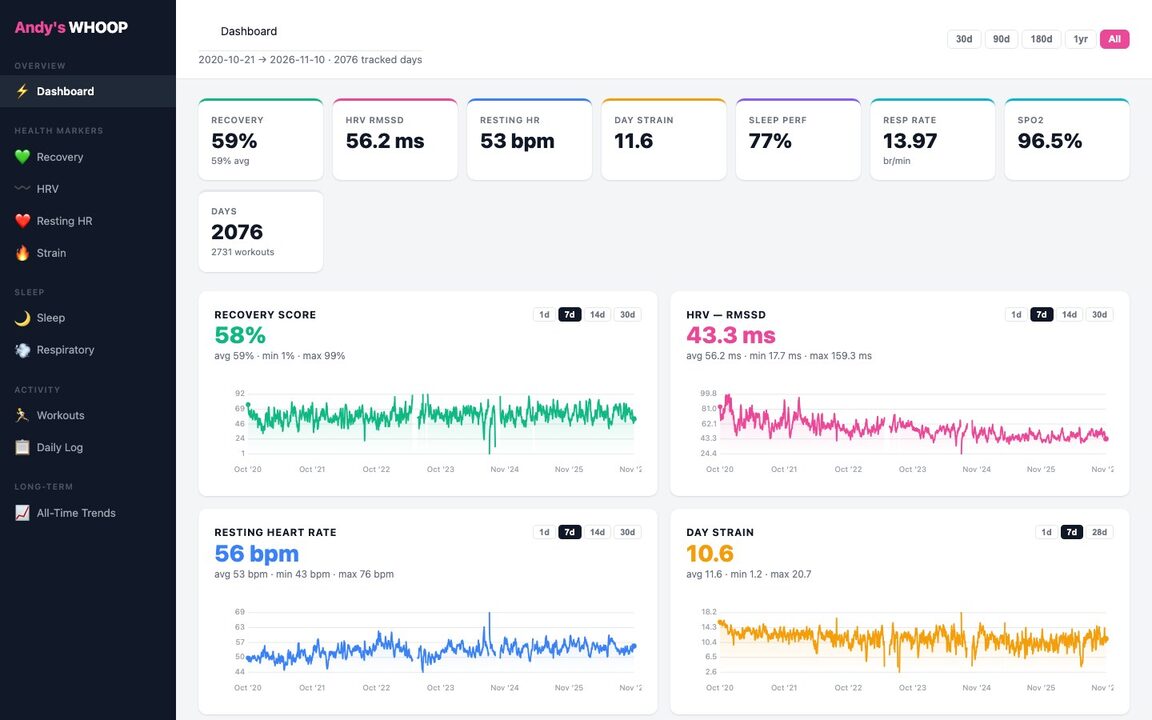 WHOOP dashboard
Data for 5+ years. What's different here is the long term trends: the app only lets you see 6 months.
2026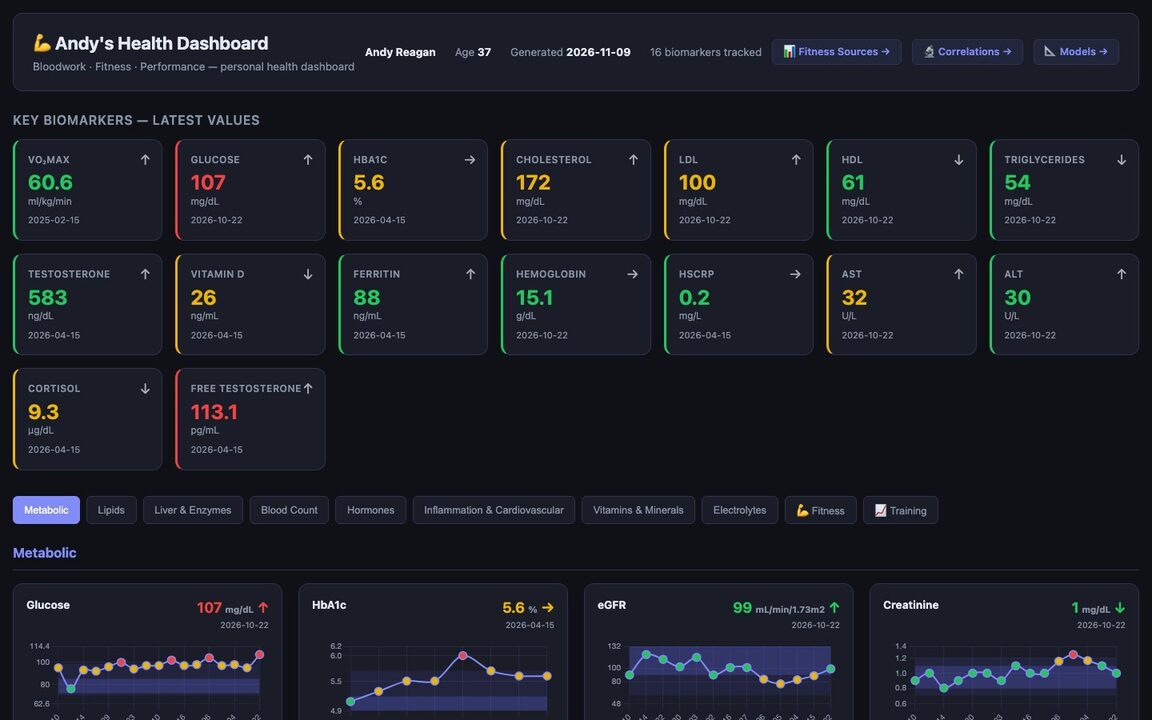 Bloodwork dashboard
Every biomarker I've had drawn, plotted against its reference range over time. Correlations page is interesting!
2026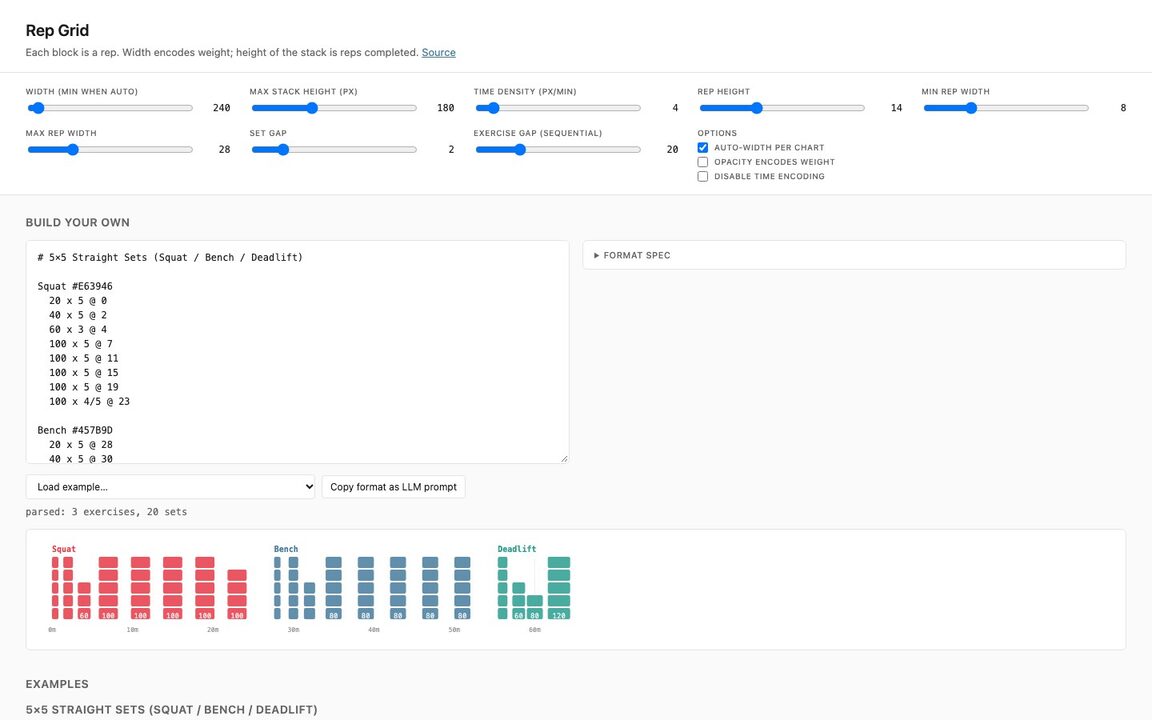 Rep Grid
A strength workout as a grid of blocks: width is weight, height is reps. Exploratory, I don't love these tbh.
post · 2026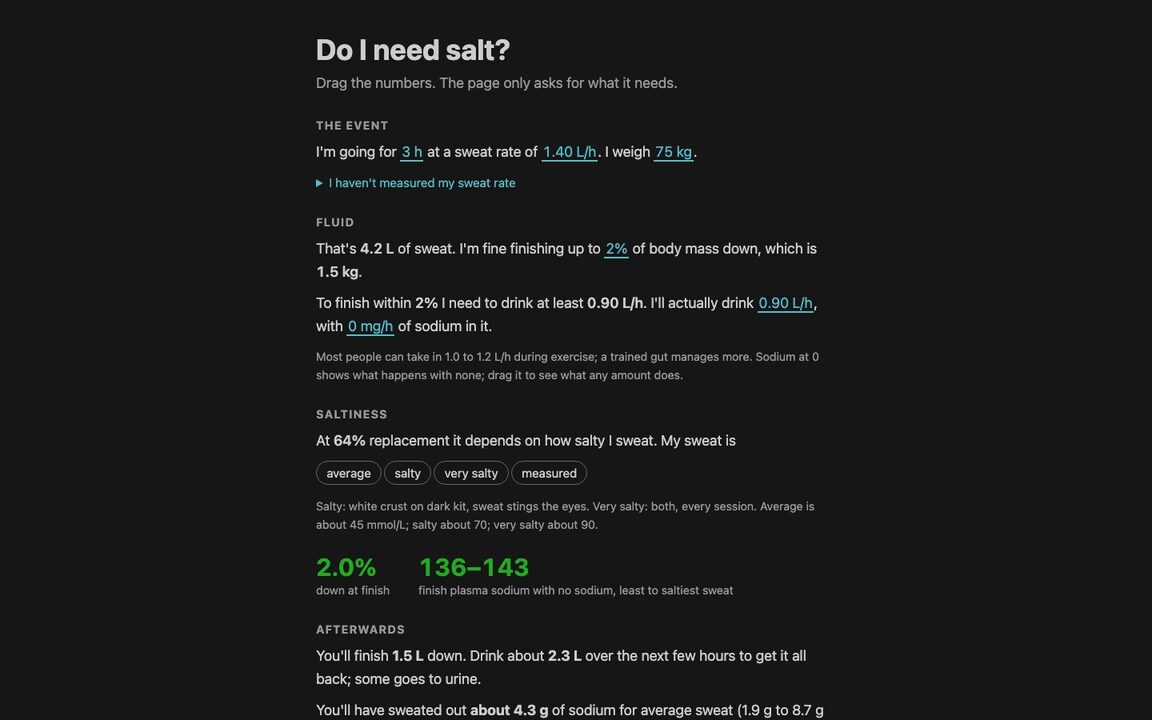 Do I need salt?
A simulator of fluid and sodium balance, to help me understand and poke holes in recent research. You probably don't need salt (!!).
2026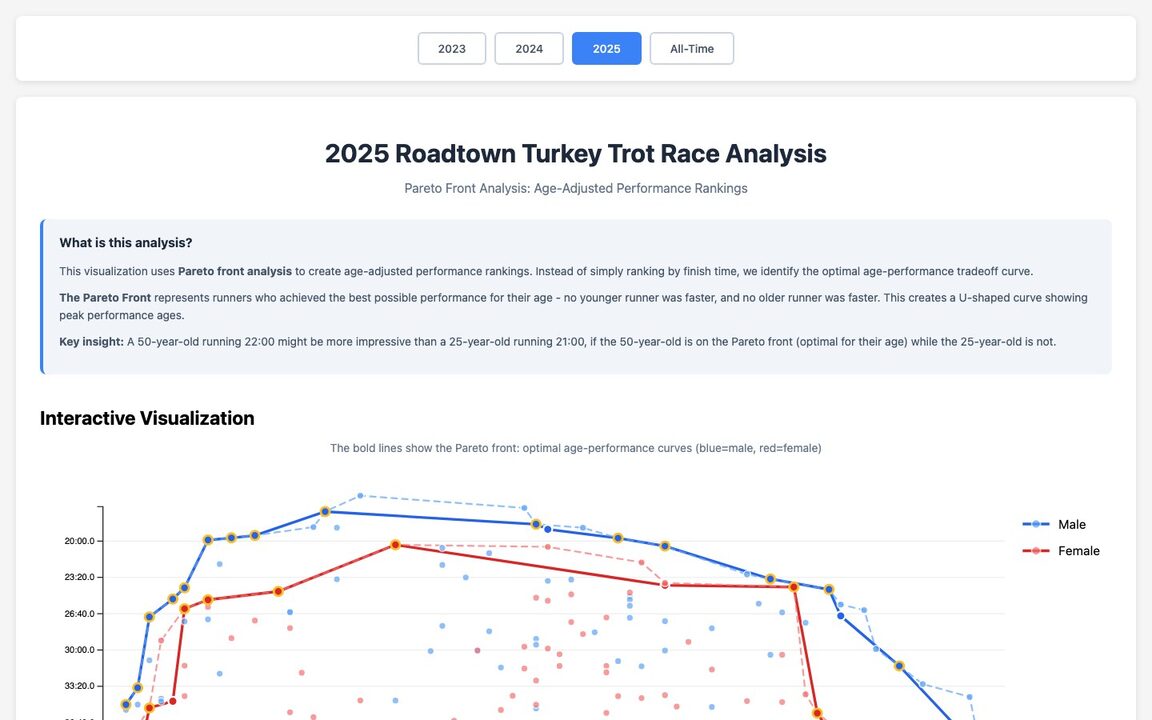 Turkey Trot Pareto fronts
Age-adjusted race rankings, a double pareto: you get faster then, the slower. I'm over that hill, the kids are climbing it!
2025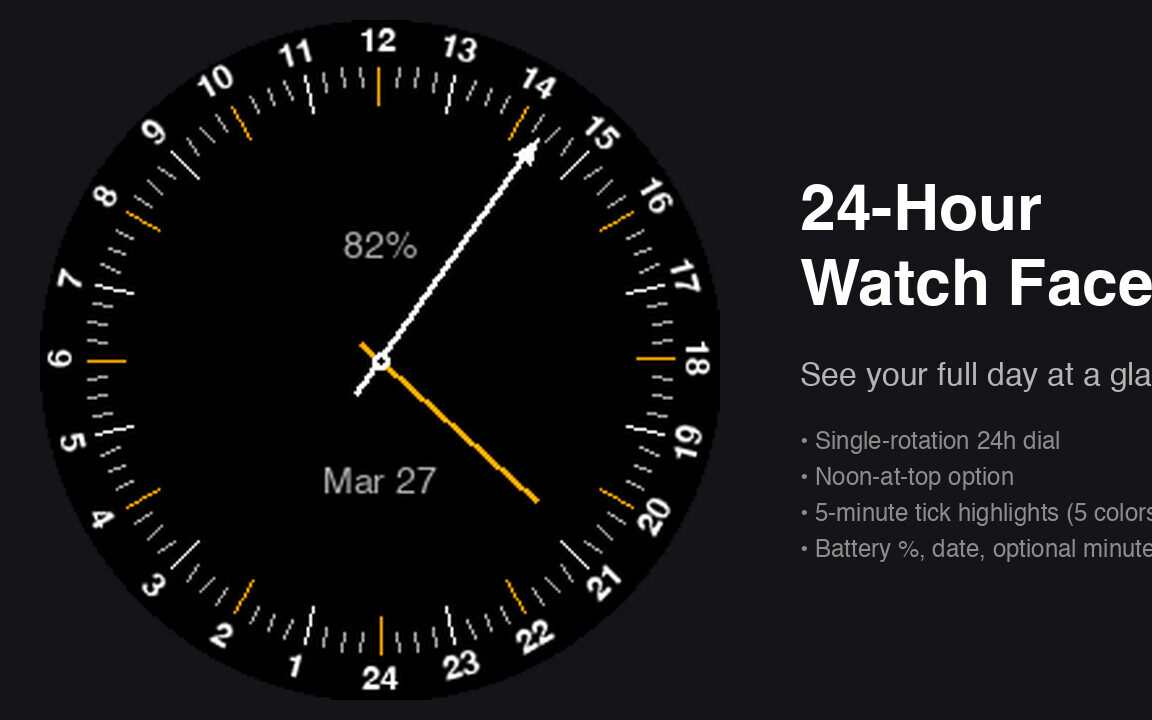 24-hour Garmin watch face
One rotation of the hour hand per day, noon at the top.
post · code · 2026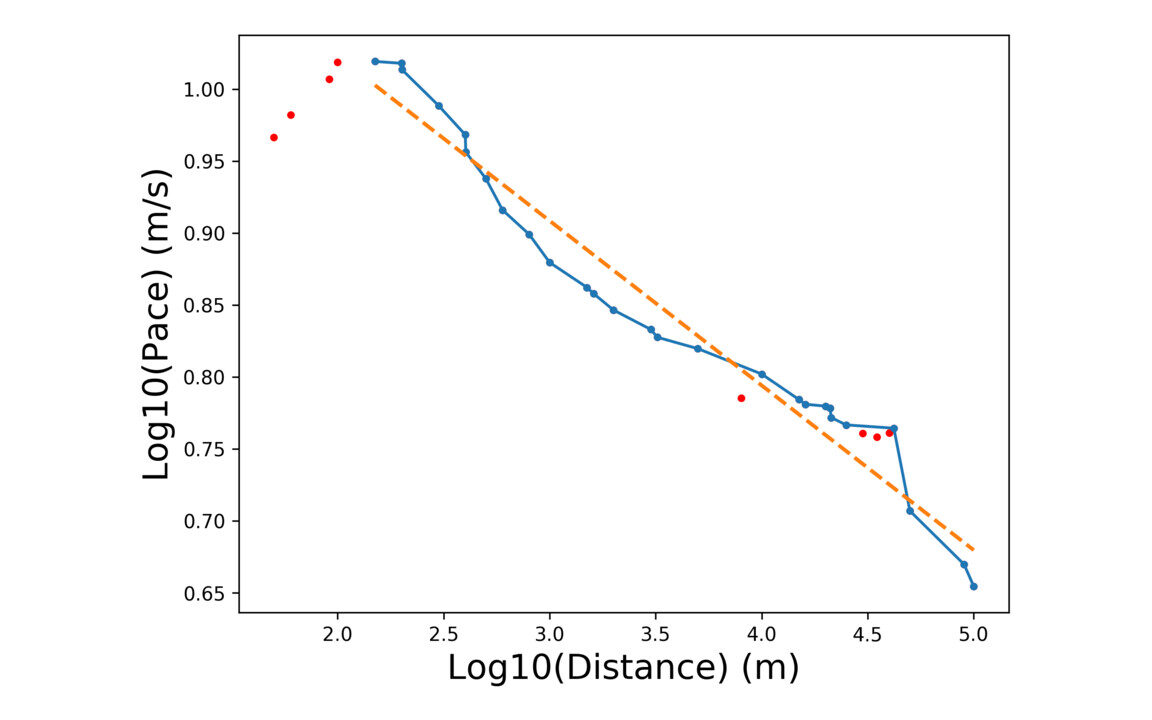 Yasso 800s
Running world records on log-log axes, with a power-law fit, to check the Yasso 800 marathon predictor.
code · 2019, updated 2026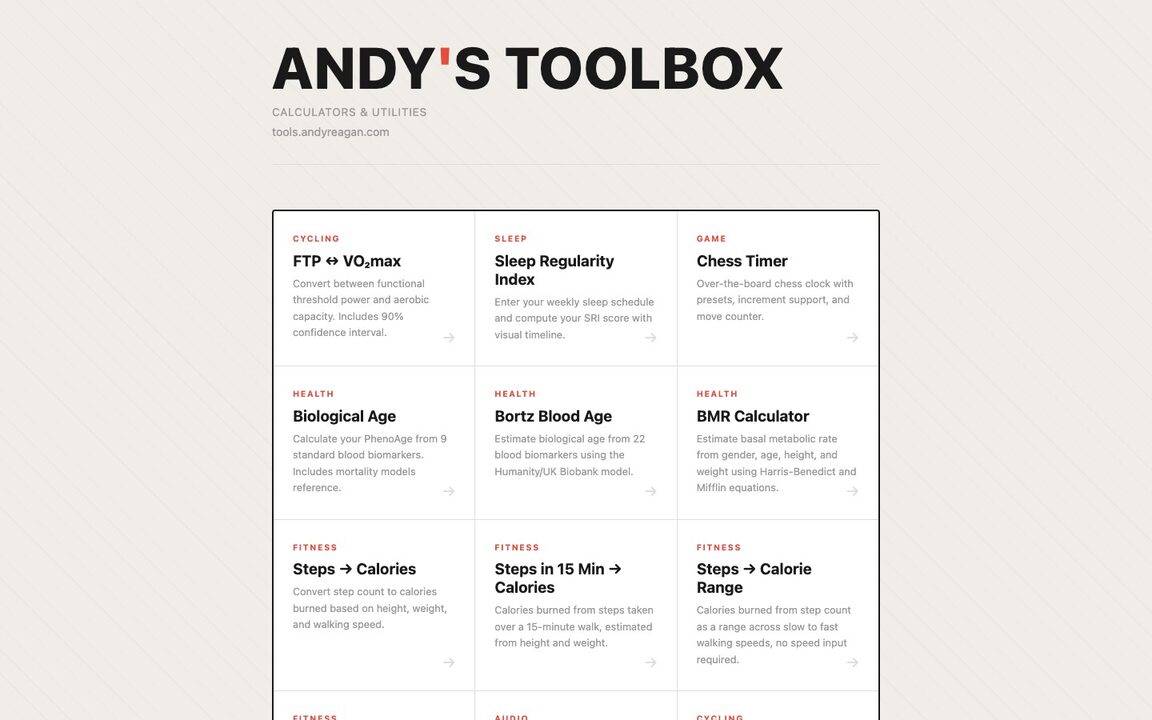 HTML Tools
Collection of single-page html tools and calculators: biological age, FTP to VO₂max, sleep regularity, and more.
2026
Computational Story Lab, 2012-2017
From my PhD at UVM: measuring happiness, stories and calories in very large piles of text. Nearly all of it is d3.js, with Python, Django and nginx behind it, and it is still running a decade later. The d3 lib, shifterator, was recently updated as well.
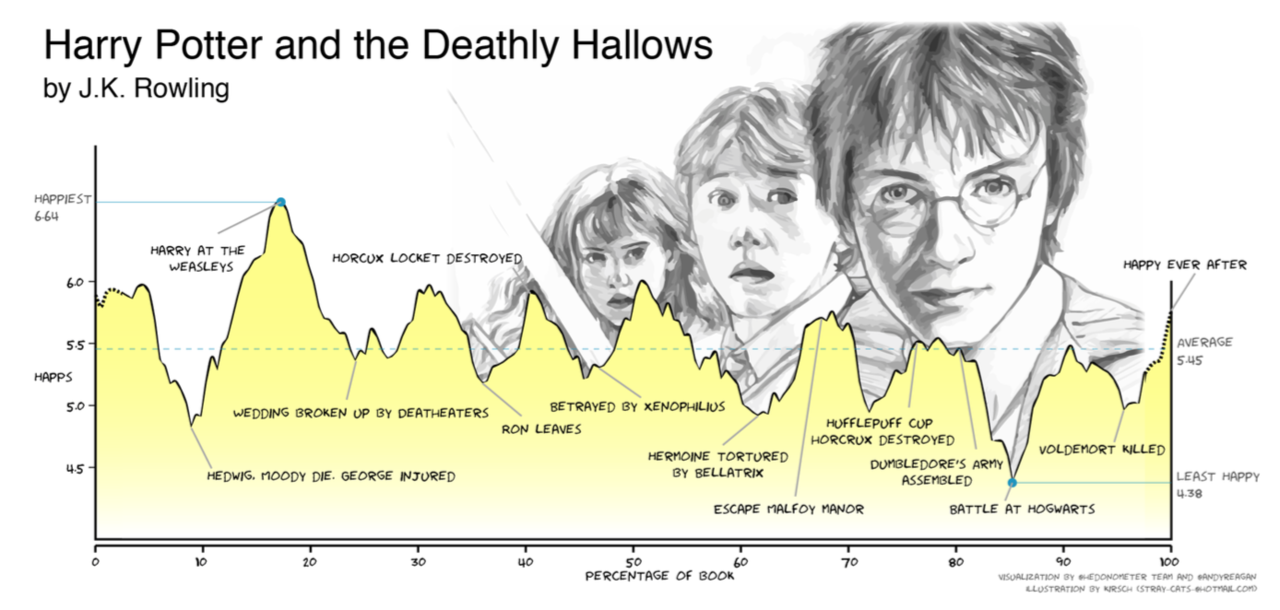 The emotional arc of Harry Potter
The annotated arc of Deathly Hallows, from the shapes of stories paper.
post · paper · EPJ Data Science, 2016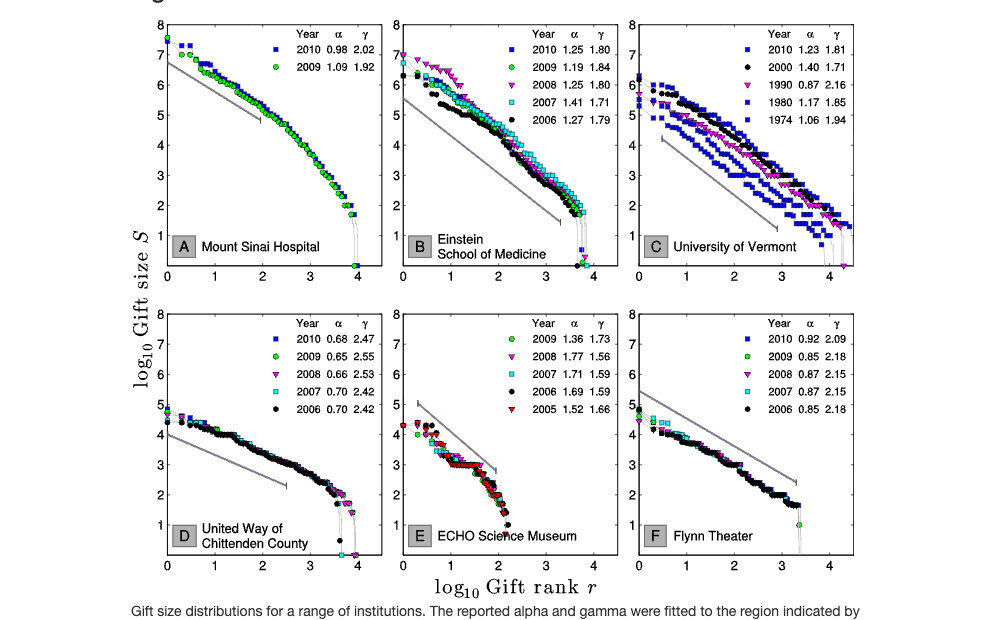 Collective Philanthropy
My first visualizations, made in MATLAB: gift size distributions for the philanthropy paper.
PLOS ONE, 2014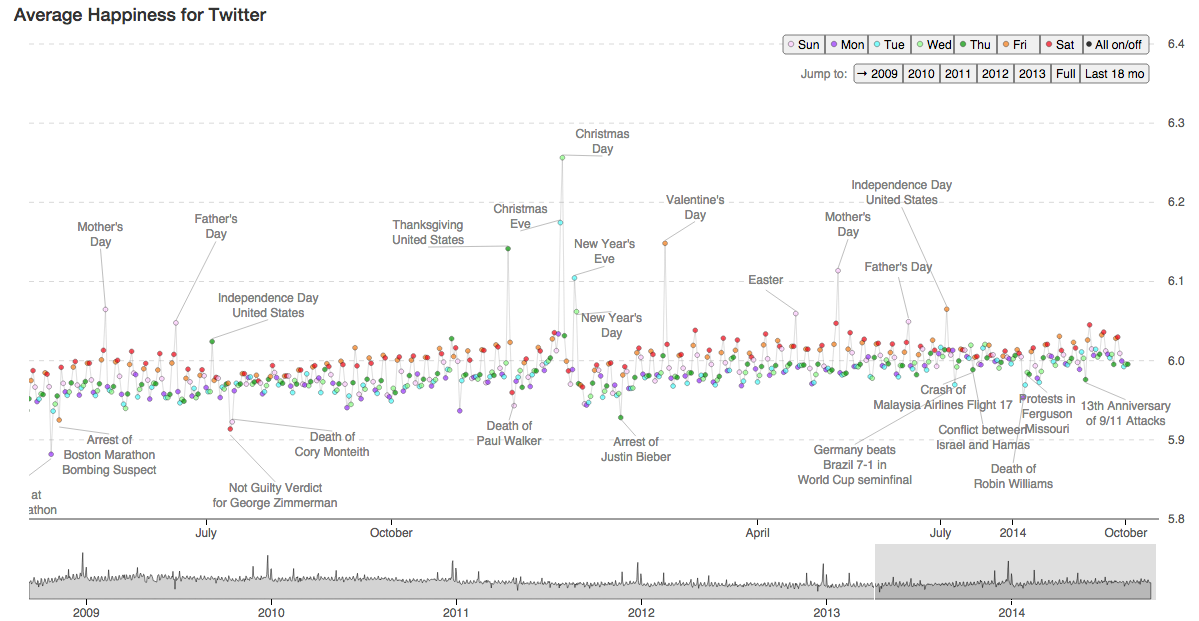 Hedonometer
The average happiness of Twitter, day by day since 2008, annotated with what happened.
hedonometer.org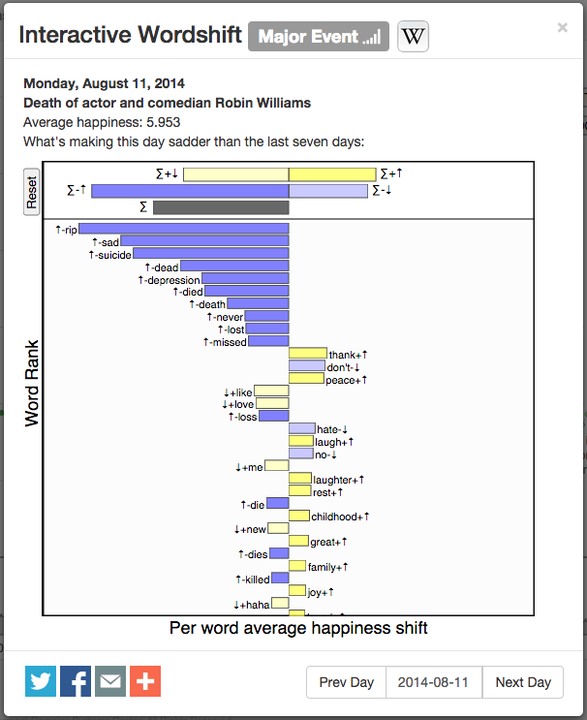 Interactive word shifts
Click any day to see which words made it happier or sadder than the week before.
hedonometer.org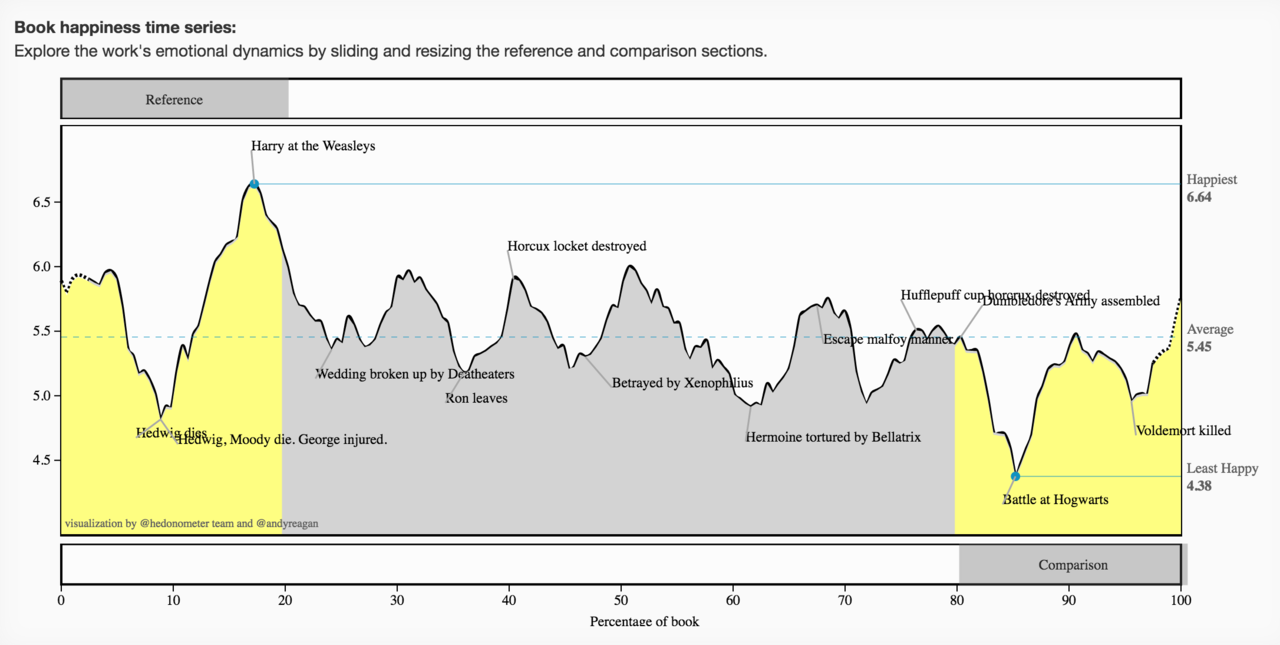 Book viewer
The emotional arc of a book with crowdsourced annotations. Here, all seven Harry Potters.
hedonometer.org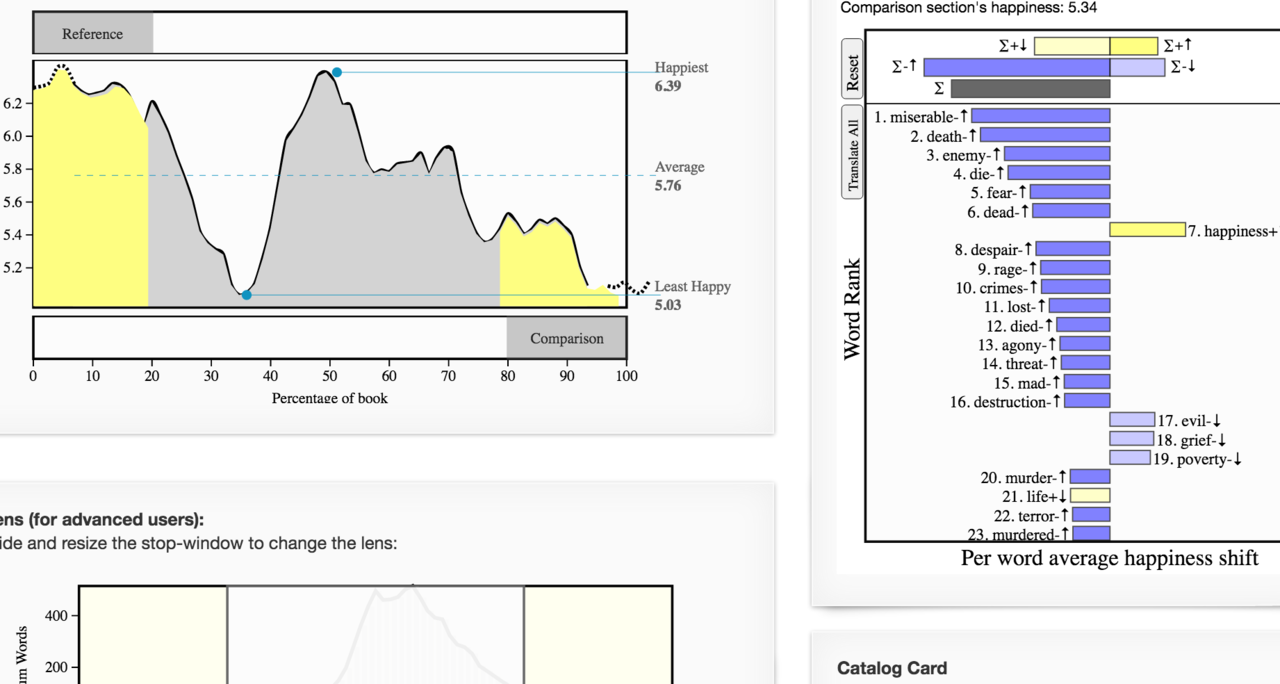 Shapes of stories
Slide two windows along a novel and compare the words inside them.
hedonometer.org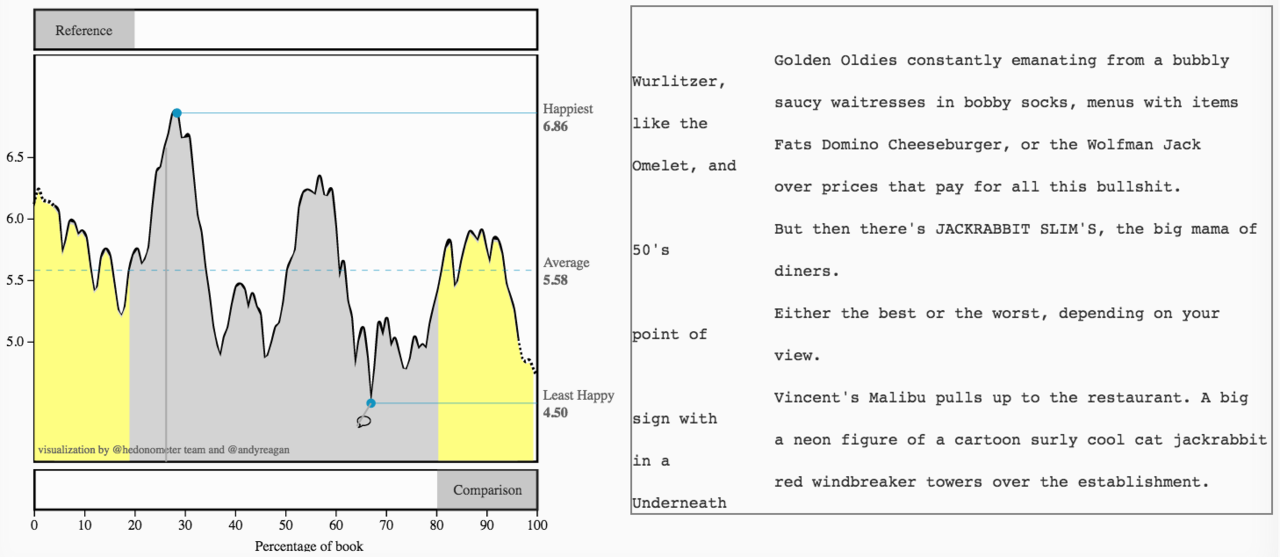 Movie viewer
The same arc for film scripts, with the script scrolling alongside.
hedonometer.org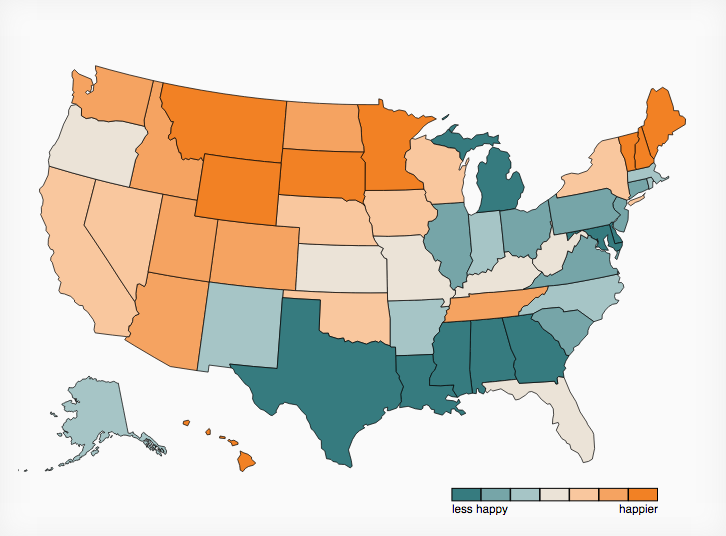 Happiness of the US
State-by-state happiness from geotagged tweets; click two states to compare their words.
hedonometer.org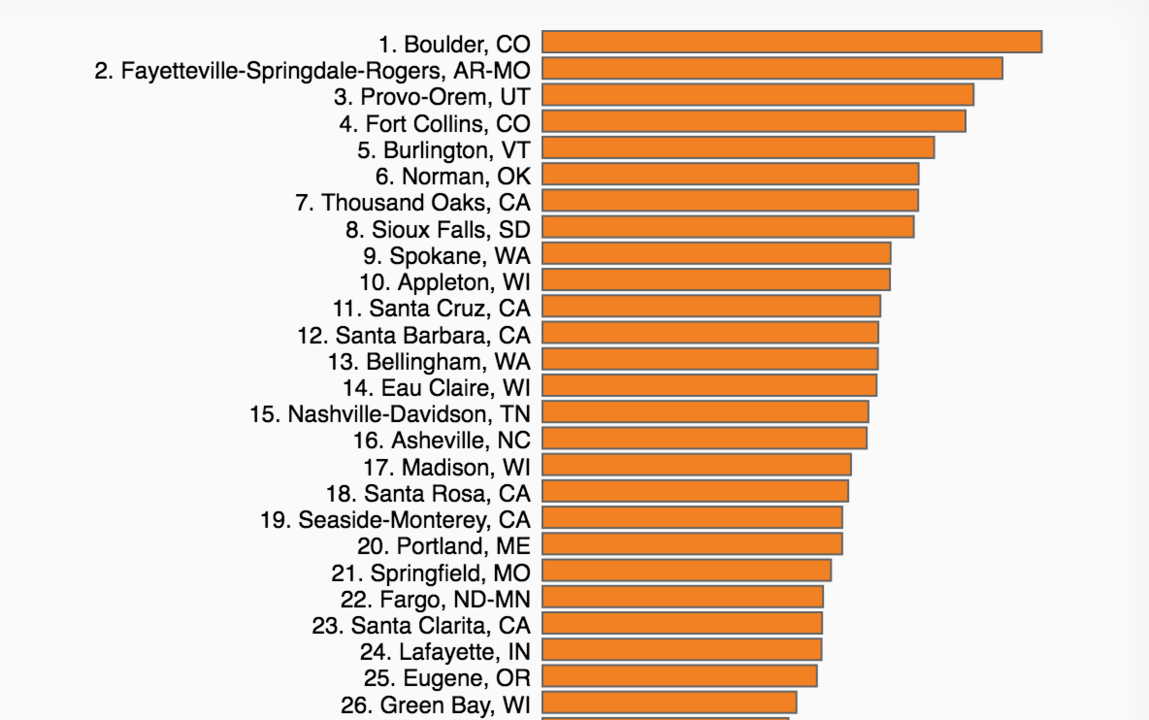 Ranked US cities
The happiest and saddest of 373 cities.
hedonometer.org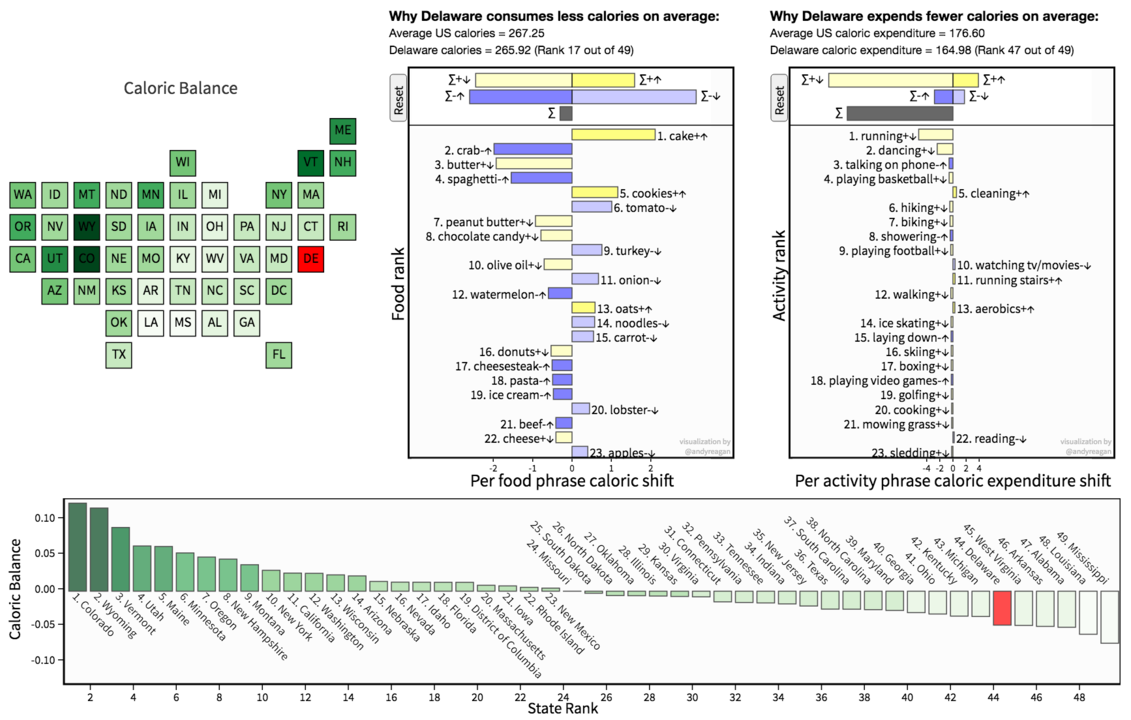 Lexicocalorimeter
Calories in and calories out for each state, estimated from food and activity words in tweets.
panometer.org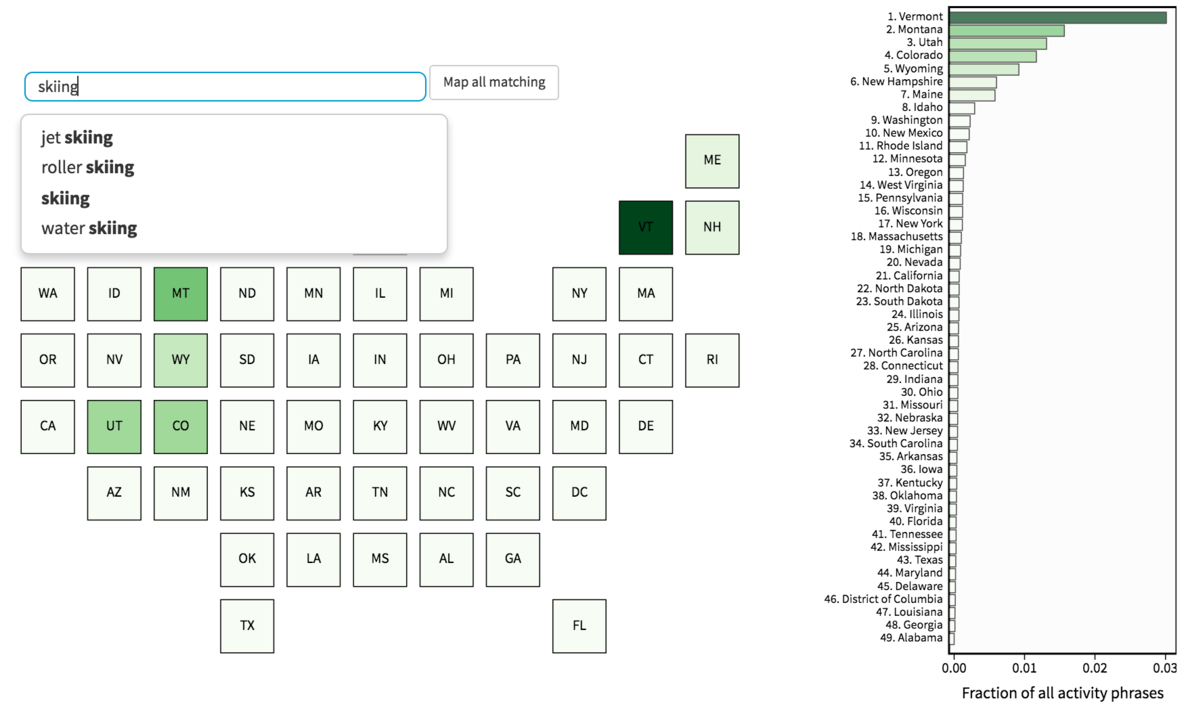 Lexicocalorimeter maps
Search any food or activity and see where people talk about it.
panometer.org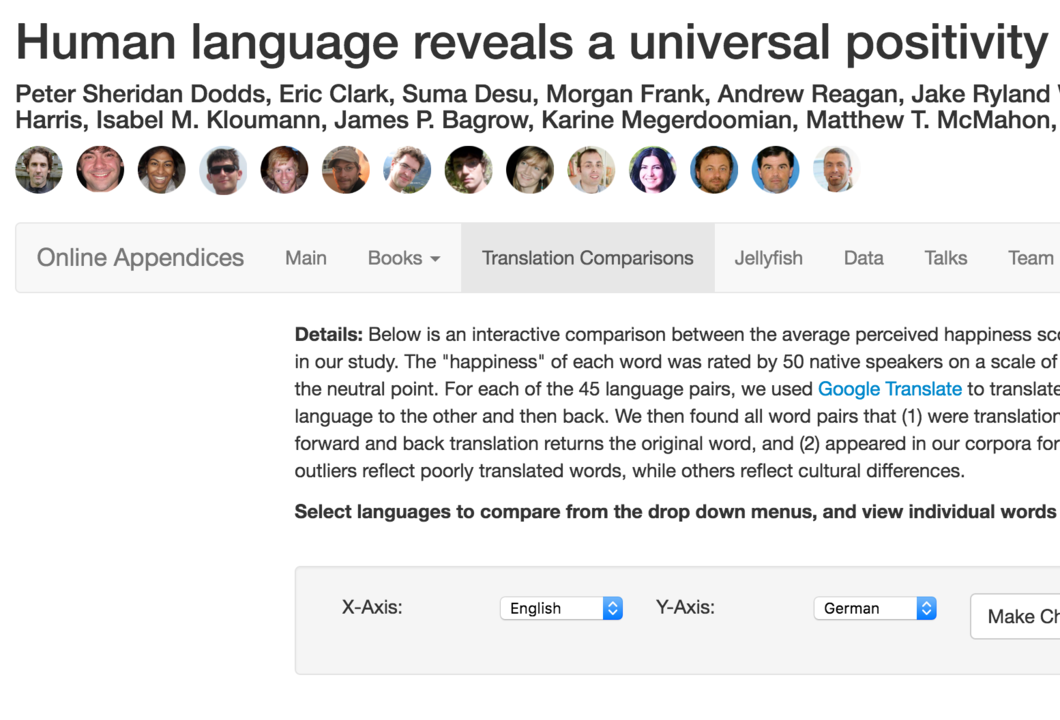 Positivity bias appendices
Online appendix for Human language reveals a universal positivity bias: word happiness compared across ten languages.
PNAS, 2015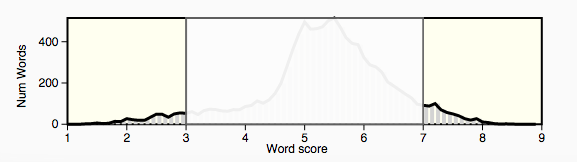 Adjustable lens
Brush away the neutral words to tune what the hedonometer sees.
hedonometer.org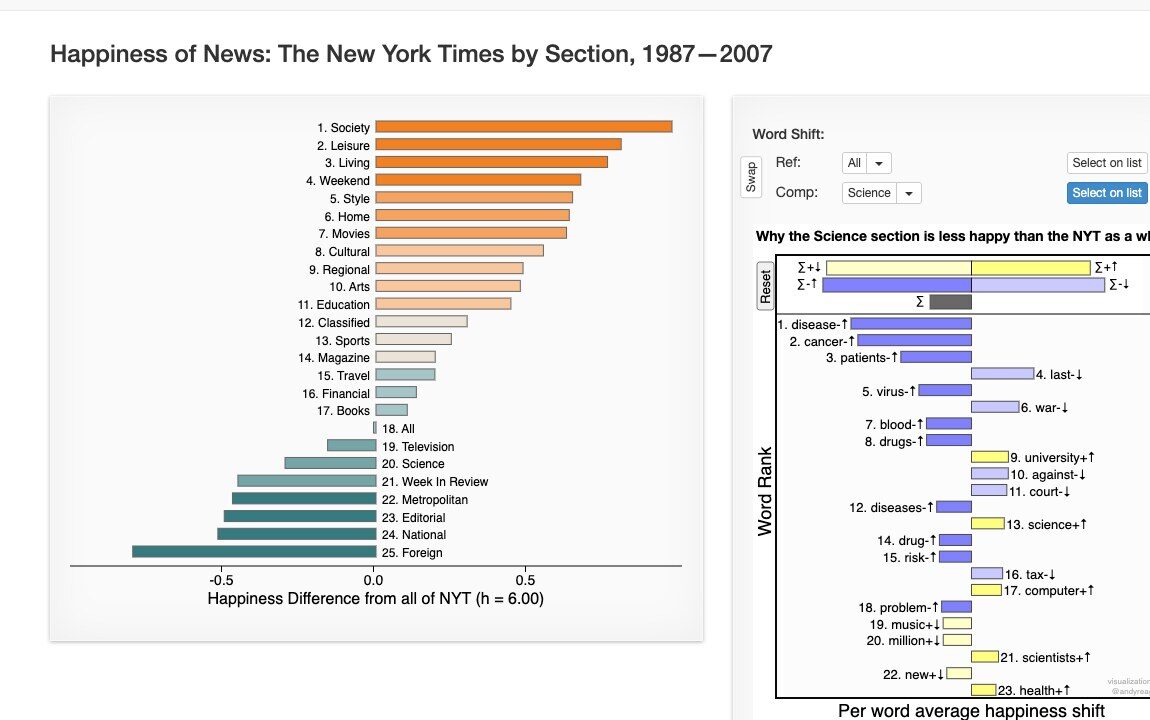 New York Times by section
Happiness of 20 years of the NYT, section by section, with word shifts.
hedonometer.org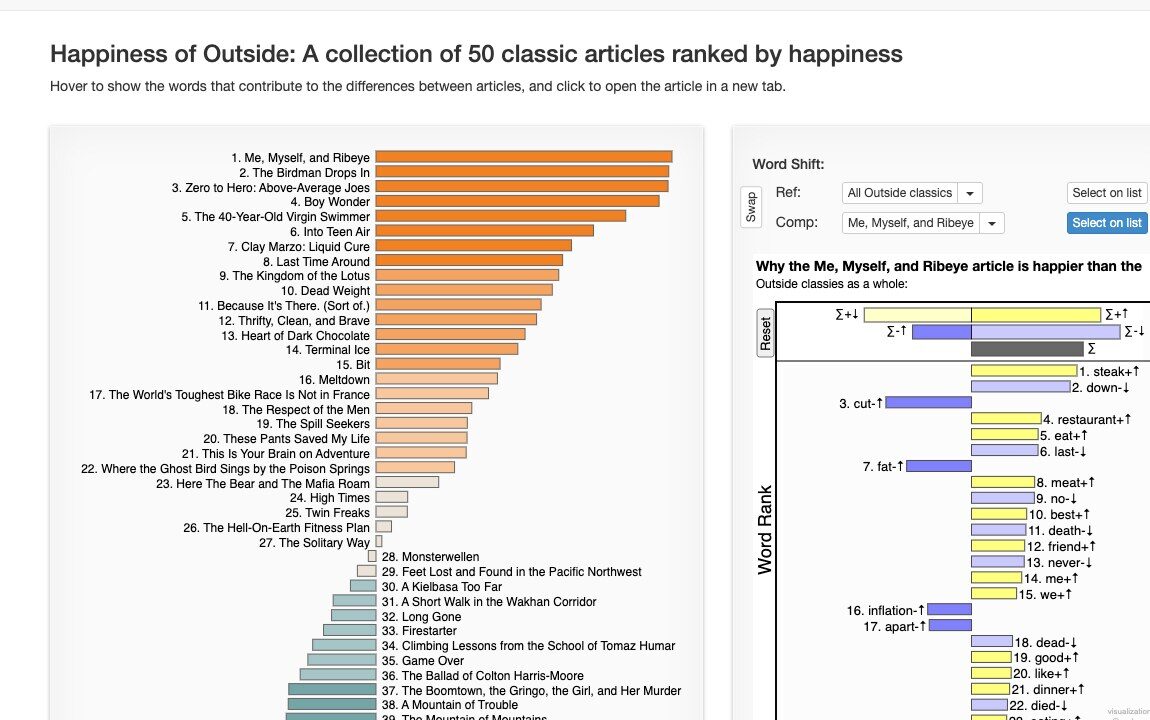 Outside classics
50 classic Outside magazine articles, ranked by happiness.
hedonometer.org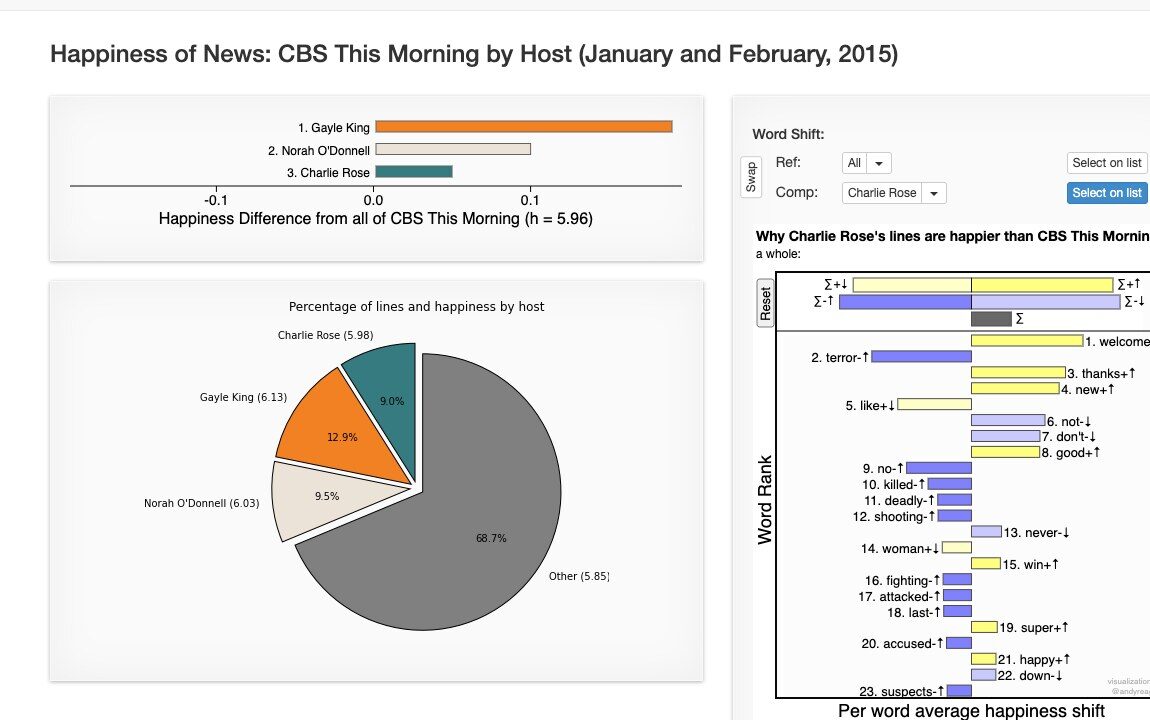 CBS This Morning by host
Who says the happy words on morning TV.
hedonometer.org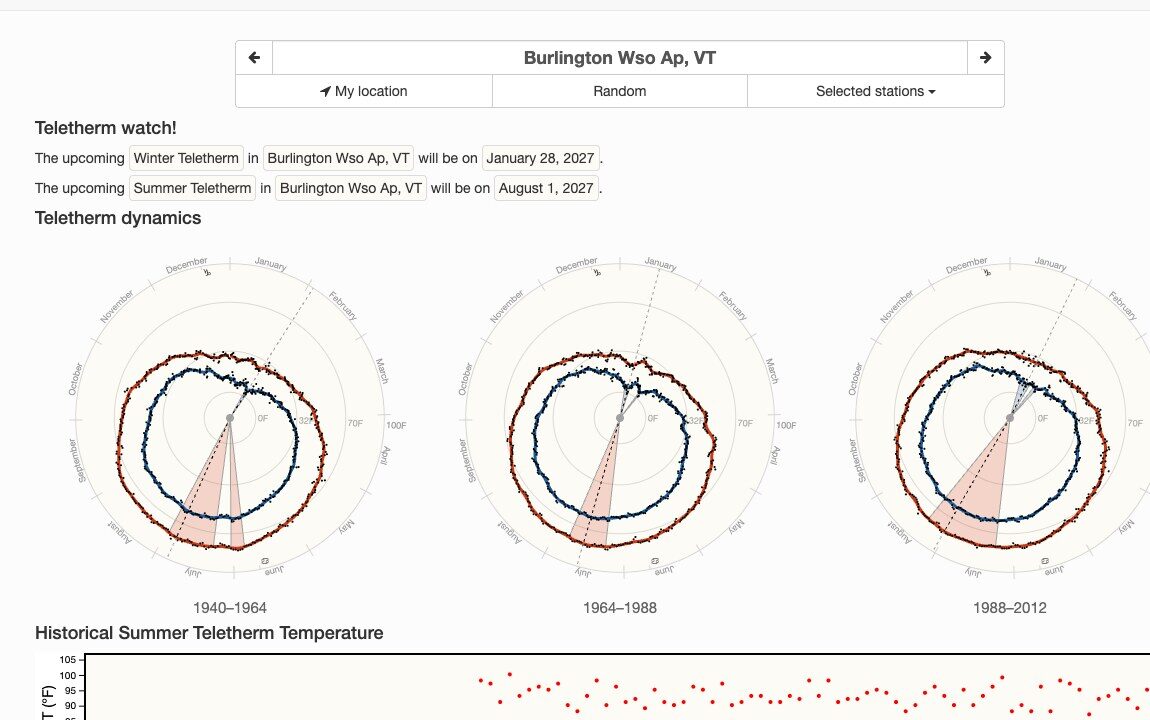 Teletherm
The hottest and coldest days of the year for every US weather station, and how they have moved.
teletherm.org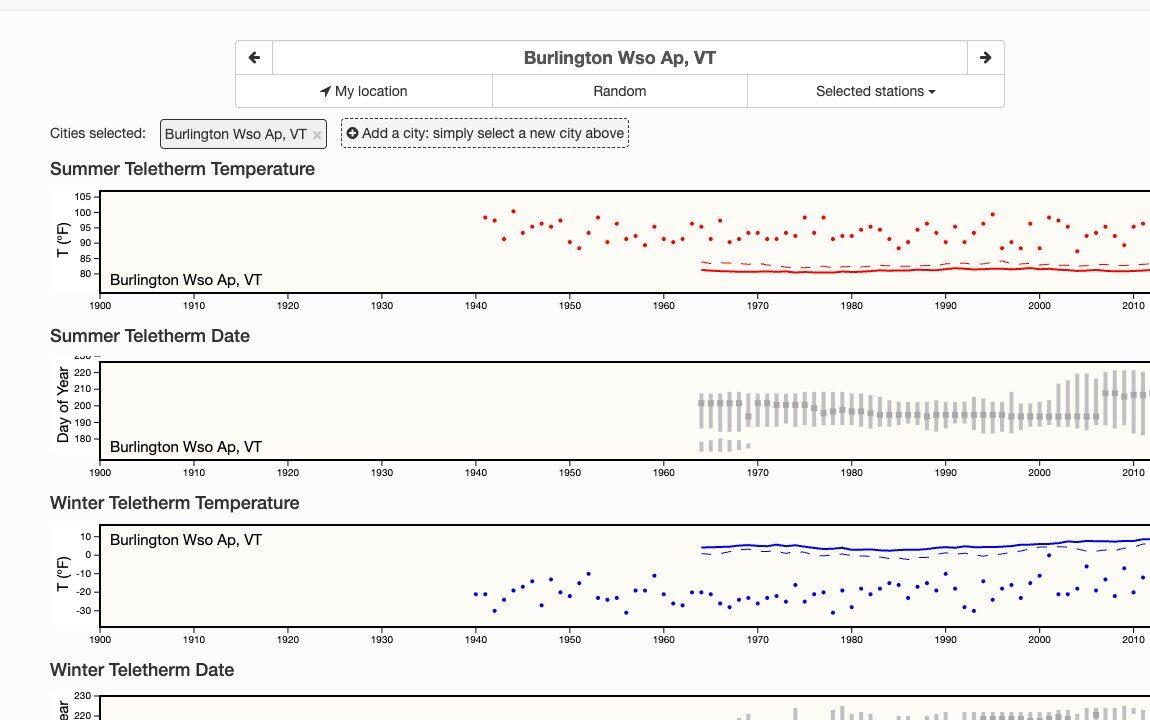 Teletherm: compare stations
Teletherm date and temperature by year, station against station.
teletherm.org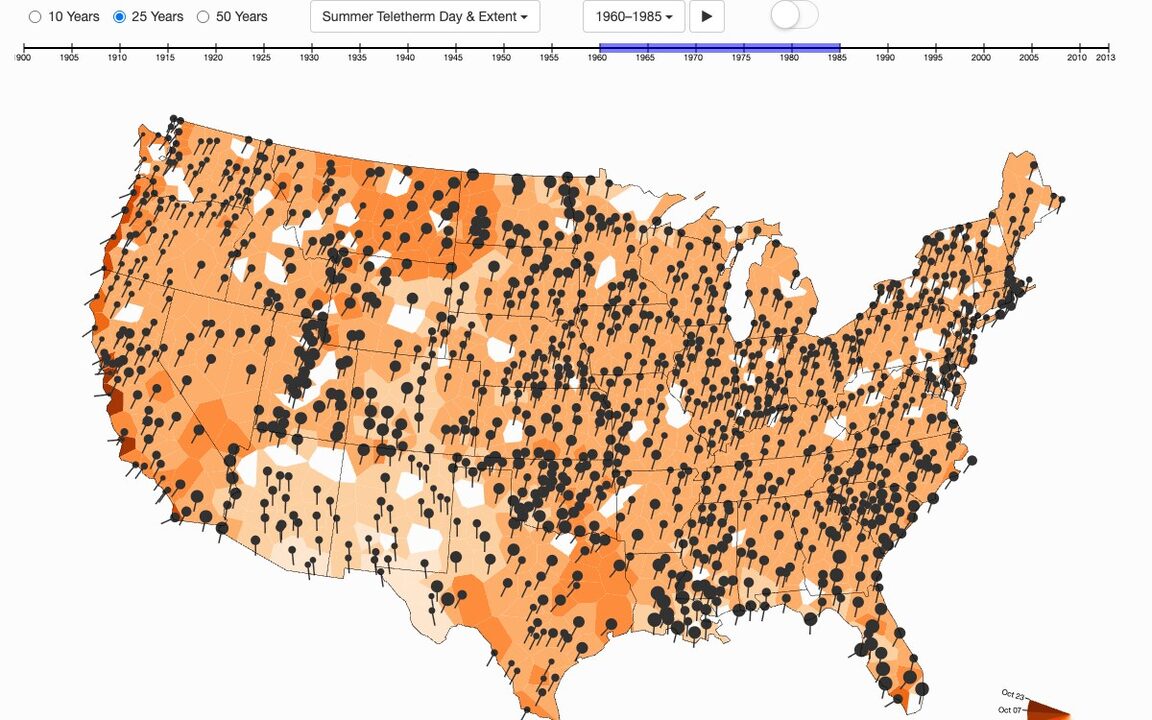 Teletherm: regional map
All the stations on a map, animated through the 20th century.
teletherm.org