Visualizing Neural Networks d3 javascript science
This semester I'm taking Applied Artificial Neural Network with Professor Donna Rizzo, and I'm learning a lot about what the heck neural network are (and what they're good for). In addition to coding up the algorithms in MATLAB, we've been encouraged to explore what's going on to build our intiutions of the different approaches. So, after getting it to work in MATLAB, I coded a Bidirectional Associative Memory network in Javascript and used some d3 action to make a plot of the behavior.
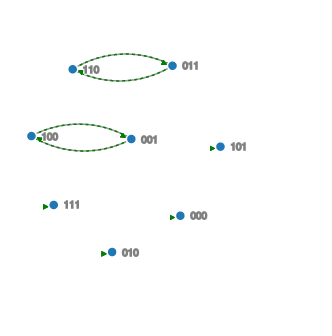
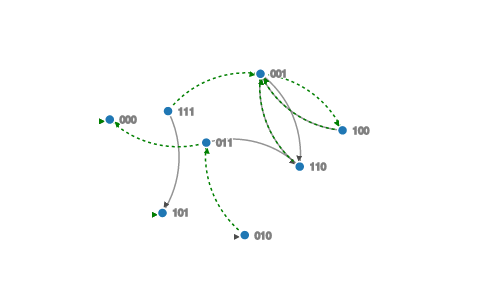
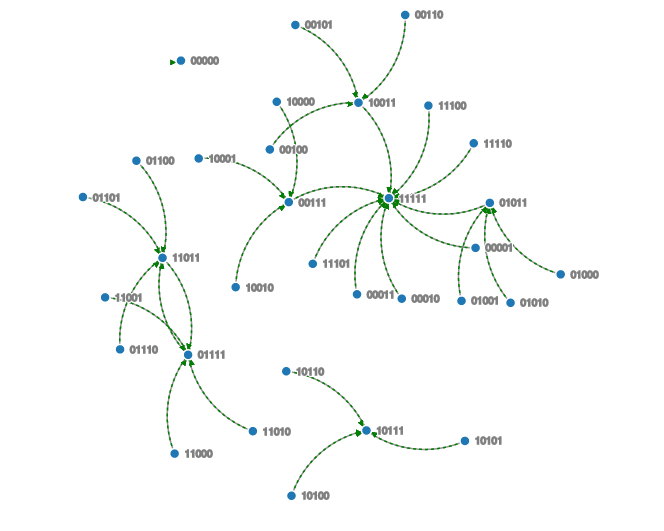
Here is a look at the state space of a few different, with lines showing the trajectories taken under iteration of the network. Starting at any given node with state A, the weight matrix W sends you to a new state B along a black line. Then the transpose of the wieght matrix W sends your back from B along the green dashed line. For different training data (different memories coded into the weight matrix) we get very different behavior.
3D binary state space with stable associated memories:

3D binary state space with unstable associated memories:

5D binary state space with an unstable highly associated memory:

You can check out a live demo here.
Of course, the full code is available under hw03 of the github.